top of page
fx-CG20

Beautiful Display -High resolution and Color-
More than 65,000 colors for menu and loadable pictures.

Bringing real images to math -Picture Plot-
Picture Plot enables users to create their own graphs over pictures displayed on the color LCD. The fx-CG10/20 comes with 55 types of color pictures that users can create graphs over, such as a picture of the parabola of jets from a water fountain and an image sequence of a clock’s pendulum movement. Users can perform regression calculations from the completed graphs to enhance their understanding of math functions.

Explore math -Powerful calculator applications with color-
Color Link function makes it easy to understand relationship between graph and data.
USB mass-storage
No special software required for data transfer
A USB mass storage function allows for quick and easy transfer for data. USB cable supplied.


Main New Features (ver3.10)
3D Graph Feature
Take advantage of easy-to-operate, high-definition 3D Graph in mathematics learning that is intuitive and easy to understand.
Draw and display 3D Graph
3D graphs can be drawn in various ways.
1. Using templates

It’s easy to draw 3D graphs using templates. *An industry-first feature

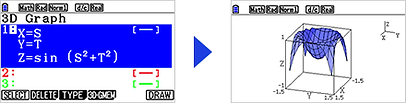
2. Z= graph

3. Parametric graphs
4. Rotating body graphs (① around X-Axis, ② around Y-Axis)
*An industry-first feature
Rotating body graphs can be drawn in two ways (rotating around X-Axis or Y-Axis).

Draw and display up to three 3D graphs
Recognize combinations of 3D graphs and interactive relationships between two or three graphs mathematically.

Investigate the relationship between expressions and 3D graphs

Select EXPRESS, VECTOR, or POINTS format when inputting expressions of 3D graphs.

Explore 3D graphs mathematically
These functions are effective in exploring 3D Graphs geometrically.
1. Viewing from various directions
①Zoom in and zoom out ②Rotation vertically and horizontally ③Cross section ④X-axis, Y-axis, Z-axis view.
These functions are effective in exploring 3D graphs geometrically.

2. Tracing of graphs
*An industry-first feature
Explore the coordinates on the surface of 3D graphs (all kinds) by using the cursor keys to move the trace pointer.
3. Intersection between graphs
*An industry-first
feature
Explore the intersection (coordinates, line) between 3D graphs (line and line, line and plane, plane and plane).
Expression of the intersection line or the coordinates of intersection
4. Relation between graphs
*An industry-first feature
Explore the relationship (parallel, orthogonal, etc.) between 3D graphs (line and line, line and plane, plane and plane).


*Based on CASIO information as of August 2017
3D Graph Samples
1. Z= graph

2. Parametric graphs

3. Rotating body graphs

Powerful advantage Features
Three key features make the fx-CG50 ideal for mathematics learning.
1. Intuitive operation
The user-friendly Icon menu, Function keys and Interactive format enable intuitive operation.

2. G-Solve feature
Use the G-Solve feature to easily solve problems involving intersections, roots, and integration.


Find the point of intersection of two graphs by simply pressing the "G-Solv" key.
3. Explore feature
Freely explore mathematics by drawing graphs on rectangular coordinates and polar coordinates.

Since rectangular coordinates and polar coordinates can be displayed on the same screen, their interaction can be understood.

Effective learning with 3D Graph
1. Draw and display 3D Graph
Students get the possibility to visualize the most important intersections between lines, planes and spheres: The intersection point, line or circle. This can be very helpful for them to develop solution strategies.

Additionally different input methods are used in all these examples.


Definition by vector, definition by equation


Definition by vector, definition by equation
Students can view graphs from various angles, and explore the intersection between 2 objects visually by themselves.

2. Explore 3D Graph
Teachers and pupils can study the relationship between lines and planes and can examine their intersections.
Intersection : Intersection point, intersection line or Not Found, etc.
Relation : Intersection, Parallel, Orthogonal, or Skewed lines etc.

E-CON4
1. This feature, with a simple user interface, is effective for collecting data for use in classroom science and technology lessons.
This feature has Auto-ID recognition, which enables automatic drawing of graphs of collected data with no complicated settings.
Effective for Science and Technology Education

2. Manual Sampling Mode
This feature includes Manual Sampling Mode, which enables you to freely draw graphs of collected data.

Catalog Function
1. Select the desired command easily and quickly using the catalog function.

2. You can access online manual via smartphone / tablet by using QR Code.”


bottom of page